Staring at spreadsheets for hours, trying to make sense of complex data sets? You’re not alone. AI data visualization has transformed what used to take days into a matter of minutes.
However, choosing the right tool can feel overwhelming with dozens of options flooding the market. Each platform promises to be the best AI tool for data analysis and visualization, but not all deliver on that promise.
That’s why we’ve tested and analyzed the top 11 AI-powered visualization tools that actually work in 2025. From Tableau’s enterprise-grade solutions to Google Charts’ accessibility, we’ll break down their features, pricing, and real-world performance to help you make an informed choice.
Tableau
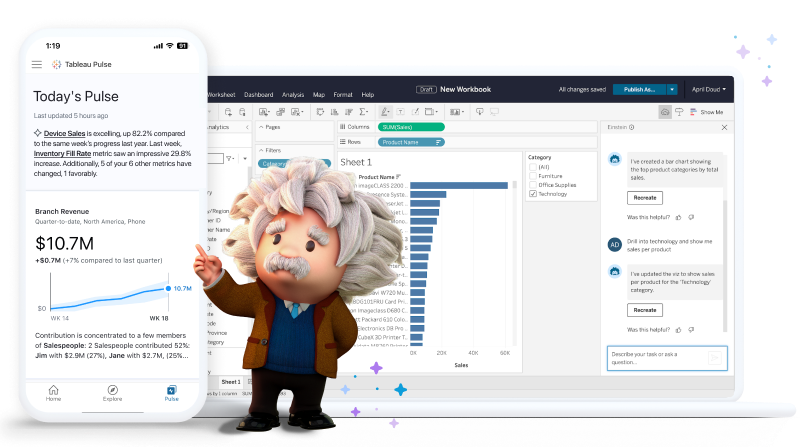
Image Source: Tableau
Tableau stands at the forefront of AI-powered analytics, offering a fully integrated portfolio that simplifies data analysis at scale [1].
Tableau’s AI Capabilities
The platform’s AI capabilities center around Tableau Agent, which accelerates data-driven decision making through natural language processing [1]. Specifically, analysts can create calculations and visualizations using conversational prompts, while Tableau Pulse delivers automated analytics in plain language [1]. Furthermore, the Einstein Trust Layer ensures data security and privacy across all AI operations [1].
Tableau Pricing and ROI
Tableau+ serves as the premium package for organizations seeking AI-powered analytics [2]. The platform includes:
- Einstein Copilot for advanced catalog assistance
- AI-powered data preparation tools
- Embedded analytics capabilities
Tableau Integration Options
The platform excels in integration flexibility, connecting seamlessly with various data sources [3]. Additionally, Tableau offers native connectors for databases and files, from spreadsheets to big data warehouses [3]. Moreover, the platform supports analytics extensions that leverage popular data science programming languages, including R, Python, and MATLAB [3].
The platform’s extensibility allows developers to create dashboard objects that integrate data from other applications directly in Tableau [3]. Consequently, organizations can embed interactive analytics into custom web portals and customer-facing products, maximizing their existing data infrastructure investments [3].
Microsoft Power BI
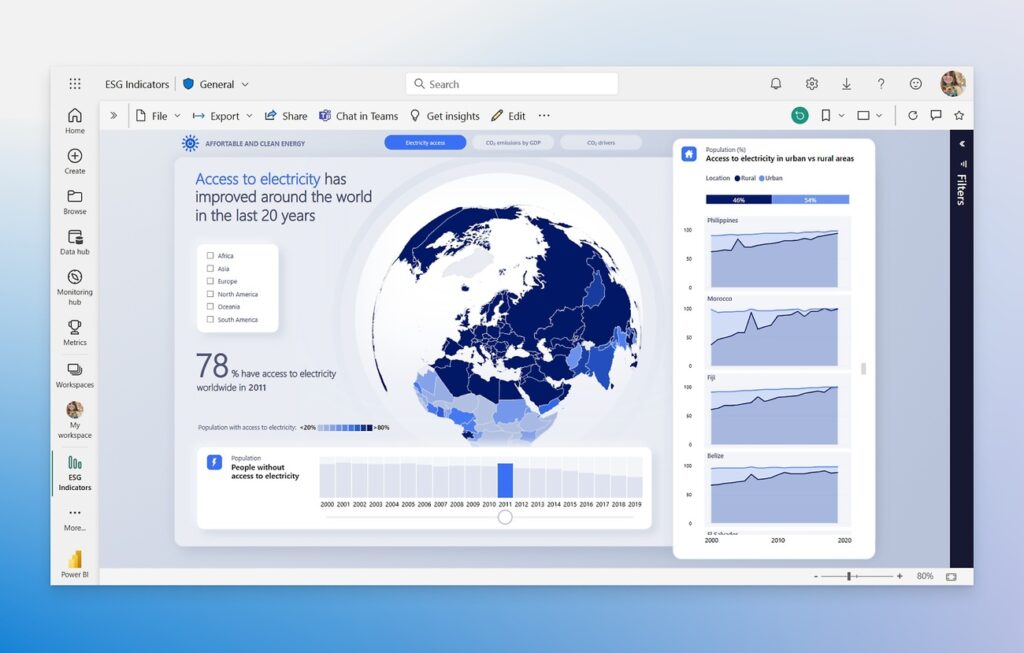
Image Source: Microsoft
Microsoft Power BI sets itself apart through advanced AI capabilities that simplify complex data analysis tasks.
Power BI’s AI Features
The platform excels in smart data discovery, enabling automatic pattern detection and visualization creation [4]. Text Analytics and Vision functions process unstructured data, offering sentiment analysis, language detection, and image tagging capabilities [4]. Notably, the platform includes pre-trained machine learning models that enhance data preparation efforts [4].
Power BI Cost Analysis
The pricing structure offers multiple tiers to suit different organizational needs:
- Power BI Pro: $10 per user/month [5]
- Power BI Premium Per User: $20 per user/month [6]
- Power BI Premium Per Capacity: $4,995 per month [6]
Initially, users with Pro licenses can publish and share content, whereas Premium unlocks advanced AI capabilities like AutoML [5].
Power BI Enterprise Integration
The platform primarily integrates with Microsoft’s ecosystem, offering seamless connectivity across Microsoft 365 applications [7]. Users can embed Power BI reports directly into Teams, Excel, PowerPoint, and SharePoint [7]. Essentially, this integration extends to Azure applications, enabling analysis of petabytes of data with advanced AI capabilities [7].
The platform supports self-service business intelligence, allowing users to create and publish reports independently [7]. Through Azure Machine Learning integration, data scientists can grant access to ML models using straightforward point-and-click gestures [4]. The system automatically batches access requests when invoking Azure ML models, ensuring optimal performance across large datasets [4].
ThoughtSpot
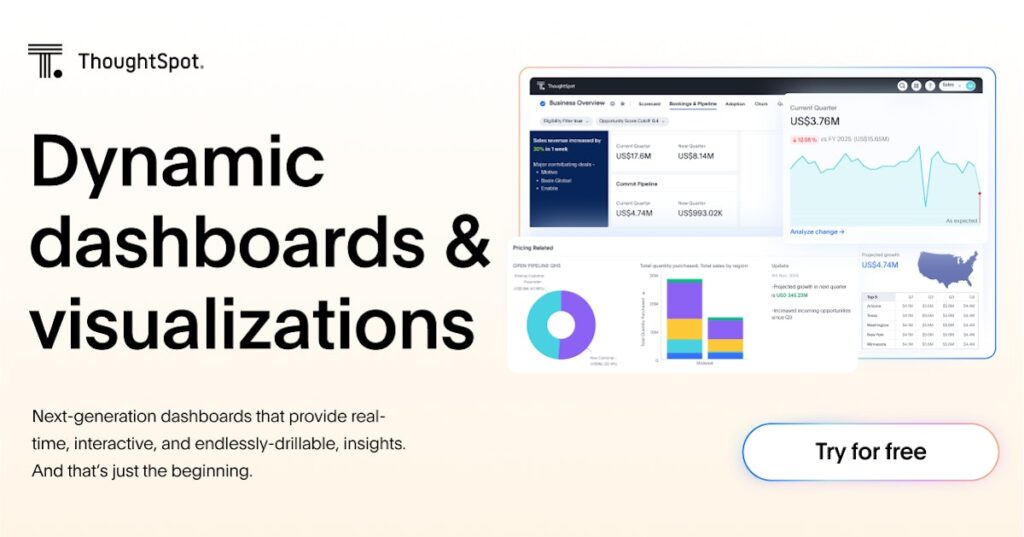
Image Source: ThoughtSpot
ThoughtSpot brings a unique approach to AI data visualization through its natural language processing capabilities.
ThoughtSpot AI Technology
The platform’s cornerstone is Spotter, a generative AI-powered agent that enables conversational interactions with structured data [8]. Through large language models like GPT and Google PaLM, users can explore complex business questions using natural language [9]. The system offers:
- AI-driven search experience
- Real-time data monitoring
- Interactive data visualizations
- Mobile accessibility for insights
ThoughtSpot Pricing Structure
The platform operates on a consumption-based pricing model, where billing depends on credits [10]. Primarily, the system measures usage through query-based and time-based metrics. Subsequently, user activities such as performing searches, viewing Liveboards, and creating Worksheets consume these credits [10].
ThoughtSpot Implementation Guide
The platform prioritizes security through granular controls and a centralized governed system [9]. Accordingly, organizations can restrict unauthorized access while maintaining data integrity. The system supports integration with multiple cloud platforms, therefore enabling compatibility with popular LLMs, including ChatGPT and Google Gemini [8].
The platform’s DataRank machine-learning algorithm improves through human feedback, allowing organizations to customize the system according to their needs [11]. For enterprise deployments, ThoughtSpot offers row-level security and advanced data encryption, ensuring robust protection for sensitive information [12].
Qlik
Image Source: Qlik
In 2025, Qlik distinguishes itself through its unique approach to AI-powered data visualization, combining AutoML capabilities with natural language processing.
Qlik’s AI Analytics
The platform’s Qlik AutoML enables analytics teams to create machine learning models without coding requirements [13]. Rather than requiring data science expertise, users can generate predictive models with unlimited tuning and refinement options [14]. Particularly noteworthy is the new Qlik Answers, a generative AI-powered knowledge assistant that delivers personalized insights from unstructured data sources [15].
Qlik Pricing Models
The platform offers three distinct pricing tiers:
- Standard: Starting at $825 per month for 25 GB storage and 20 full users [16]
- Premium: Beginning at $2,500 monthly for 50 GB storage and up to 100,000 basic users [16]
- Enterprise: Custom pricing with 500 GB storage minimum [16]
Qlik Enterprise Solutions
Qlik’s enterprise capabilities primarily focus on data integration and security. Indeed, the platform incorporates leading security technologies and modern open standards [15]. Similarly, the Qlik Talend Cloud integration enables automated, governed data pipelines [17]. The system likewise supports integration with multiple AI platforms, including OpenAI and Amazon Bedrock [14].
Overall, the platform’s Associative Engine works seamlessly with third-party models, enabling real-time exploration and what-if analyzes directly within business applications [14]. Hence, organizations can leverage advanced AI functionalities while maintaining data integrity and compliance standards.
Sisense
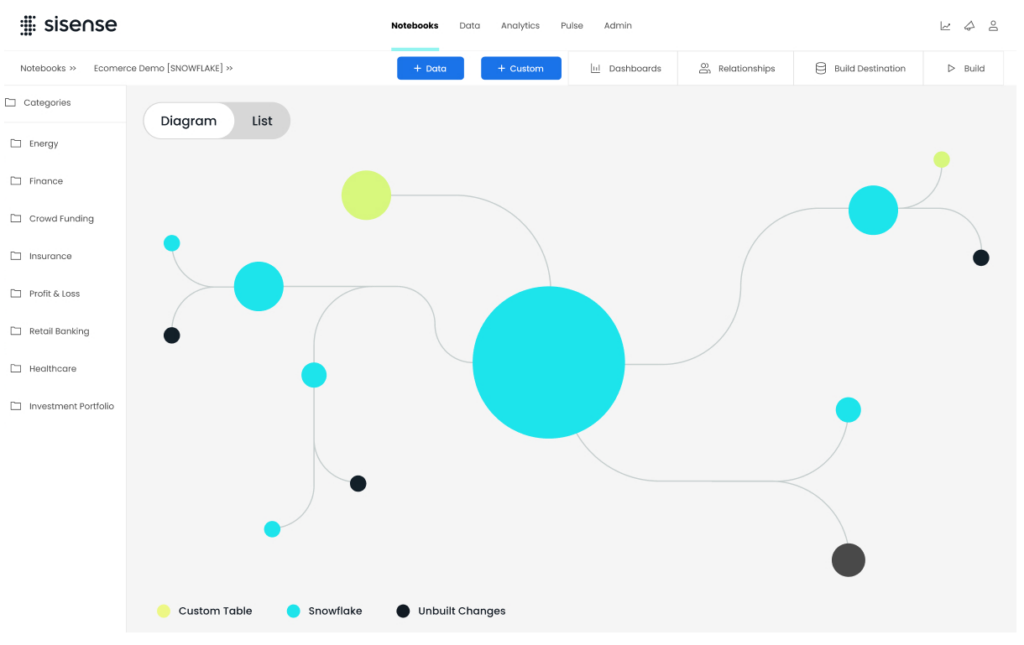
Image Source: Sisense
Sisense delivers data visualization through its patented AI Knowledge Graph technology, which studies associations between users, data, models, and formulas to create context-aware analytics [2].
Sisense AI Features
The platform’s AI capabilities center around its Analytics Chatbot, which enables users to explore data through natural language queries [18]. First of all, the system offers AI-powered data preparation tools that automatically identify and unify similar values while eliminating duplicates [2]. Besides, Sisense Forecast applies advanced ML algorithms to predict future trends, fundamentally changing how organizations approach data analysis [19].
Sisense Cost Benefits
Entry-level costs for Sisense start at USD 3000.00 per month for smaller businesses [20]. The platform offers flexible subscription-based pricing that allows organizations to:
- Scale resources based on demand
- Adjust license counts for seasonal changes
- Avoid large upfront investments [20]
Sisense Integration Capabilities
The platform maintains SOC 2 Type II, ISO 27001, and ISO 27701 certifications, ensuring robust security standards [21]. Primarily, Sisense supports integration with multiple AI platforms and offers developers complete control through API-level flexibility [18]. The system also provides embedded analytics capabilities through Compose SDK, enabling teams to integrate analytics directly into their applications [1].
The platform’s architecture supports both cloud and on-premises deployment options, offering scalability without significant infrastructure investments [20]. Through its composable design, organizations can customize their analytics experience while maintaining data security and compliance standards [19].
Looker
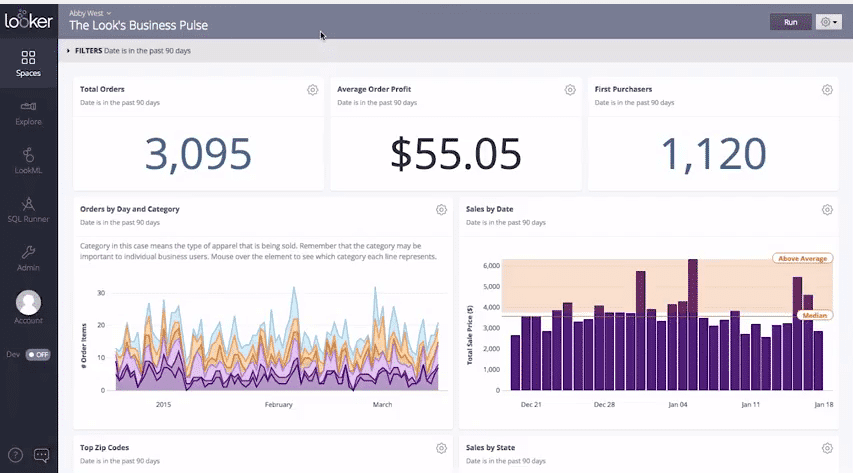
Image Source: PAT Research
As Google Cloud’s flagship business intelligence platform, Looker fundamentally changes data visualization through its semantic modeling approach.
Looker’s AI Tools
The platform’s cornerstone is Duet AI, an AI assistant that streamlines analytics workflows through powerful language models [3]. In fact, the system’s Conversational Analytics enables users to interact with organizational data through natural language queries [22]. During analysis, Looker’s semantic layer, LookML, ensures each response ties back to verified data sources [22].
Looker Pricing Plans
The platform offers three distinct editions:
- Standard: Includes one production instance, 10 Standard Users, 2 Developer Users, and up to 1,000 query-based API calls monthly [23]
- Enterprise: Provides enhanced security features with up to 100,000 query-based API calls per month [23]
- Embed: Supports external analytics deployment with up to 500,000 query-based API calls monthly [23]
Looker Technical Requirements
The platform primarily operates through an API-first architecture, enabling any workflow or application to connect with data from practically any source [3]. Simultaneously, the system maintains robust security protocols through SOC 2 Type II certification. The platform’s integration with Vertex AI provides essential tools for building custom data applications [3].
Generally, Looker excels in providing insights at the right time through proactive alerts and deep integrations [24]. The platform’s semantic model delivers a fresh, consistent view of data across multiple clouds, ensuring reliable analytics for entire organizations [24].
Polymer
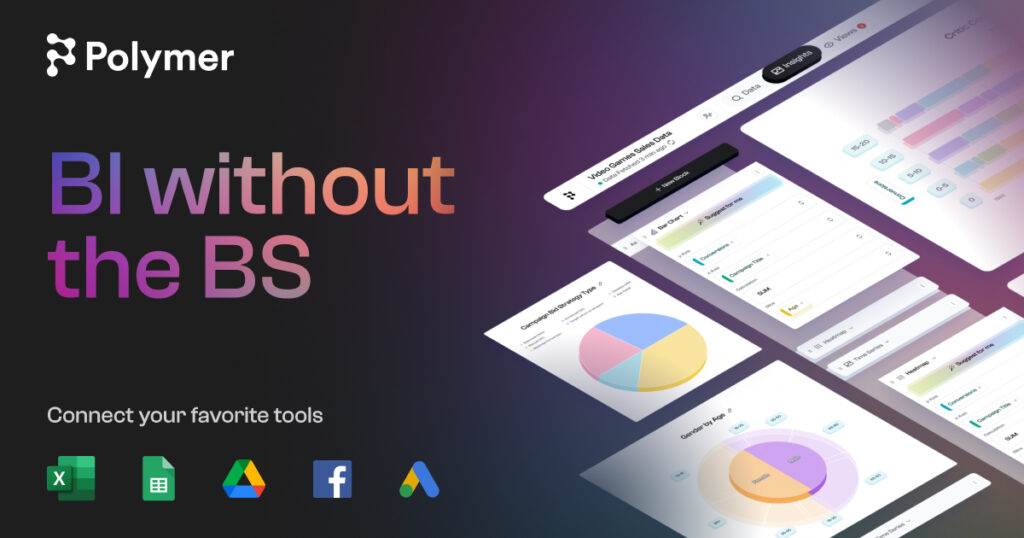
Image Source: Polymer Search
Polymer stands out in the AI data visualization landscape through its ability to transform complex datasets into interactive dashboards within seconds [25].
Polymer AI Capabilities
The platform’s core strength lies in its conversational AI interface that converts natural language queries into visual insights [25]. Fundamentally, the system automatically generates insightful dashboards and provides explanations for all charts, making data comprehension effortless [26]. The platform’s AI assistant, PolyAI, extracts insights from datasets through simple text prompts [4].
Polymer Pricing Options
The platform offers multiple subscription tiers:
| Plan | Monthly Cost | Key Features |
|---|---|---|
| Basic | $10/month | Manual data syncing, file uploads [27] |
| Starter | $50/month | Daily syncing, 10 AI responses [27] |
| Pro | $100/month | Hourly syncing, 20 AI responses [27] |
| Teams | $250/month | 3 editors, 30 AI responses [27] |
| Enterprise | Custom | API access, unlimited AI chat [27] |
Polymer Platform Integration
The system presently supports seamless integration with popular services including Shopify, Google Analytics, and Facebook Ads [25]. Evidently, the platform’s API integration capabilities enable direct connection with data warehouses and databases [28]. Ultimately, Polymer’s embedded analytics feature allows organizations to integrate interactive visualizations directly into their existing platforms [28].
Domo
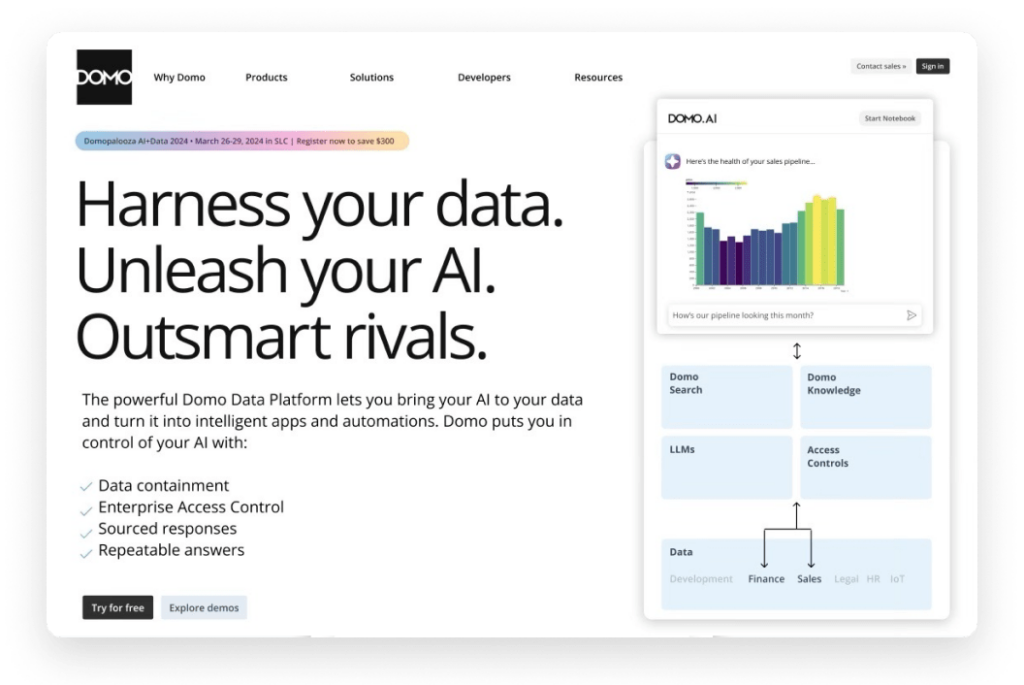
Image Source: Domo
Domo redefines data visualization through its comprehensive AI-powered platform that combines advanced analytics with intuitive user experience.
Domo AI Features
The platform’s cornerstone is DomoGPT, a private cloud model suite that processes data without external exports [29]. Primarily, AI Chat enables natural language queries about data while providing step-by-step breakdowns of answers [29]. The AI Service Layer fundamentally supports seamless integration with various AI models, including OpenAI and Google Bard [30].
Domo Cost Analysis
The platform operates on a credit-based consumption model [31]. Credits are consumed based on specific activities:
| Activity | Credit Consumption |
|---|---|
| Data Storage | 1 per million rows |
| Data Refresh | 1 per table update |
| Data Write-back | 1 per table written |
| DataFlow ETL | 1-2 per output table |
For mid-sized companies, costs typically range from $20,000 to $50,000 annually [32]. Enterprise customers might invest $50,000 to $100,000 or more, depending on usage patterns [5].
Domo Implementation Guide
The platform excels in data integration, connecting seamlessly with various sources through built-in connectors [33]. Ultimately, Domo’s AI Readiness feature enhances generative AI quality by supplying contextual metadata [29]. The system maintains robust security through advanced protocols, ensuring data remains protected within the controlled ecosystem [29].
Akkio

Image Source: Akkio
Designed specifically for advertising agencies, Akkio brings AI data visualization capabilities that streamline campaign analytics and client reporting.
Akkio AI Technology
The platform’s Chat Data Prep feature simplifies complex data preparation through conversational interactions [34]. Fundamentally, the system enables users to interact with their data naturally, making the task of data preparation more intuitive [34]. The platform’s Chat Explore capability significantly enhances data analysis by allowing users to delve deep into datasets and uncover hidden insights [34].
Akkio Pricing Structure
The platform offers multiple subscription levels:
| Plan | Cost | Features |
|---|---|---|
| Basic | $49/user/month | Chat Explore, Data Preparation, Live BI dashboards [6] |
| Pro | $99/user/month | Time Series Forecasting, Advanced Model Operations [6] |
| Build-On | $999/month | Branded analytics, API integration [6] |
| Enterprise | Custom | Dedicated infrastructure, Custom LLMs [6] |
Akkio Integration Options
The platform undoubtedly excels in connectivity, supporting integration with numerous data sources including:
- MongoDB, Amazon Redshift, and PostgreSQL [35]
- Google Analytics 4 and Hubspot [35]
- Snowflake and Big Query for enhanced productivity [35]
Ultimately, Akkio’s API integration capabilities enable direct connection with various business systems, while maintaining robust security protocols through advanced information security controls [36].
HiPlot
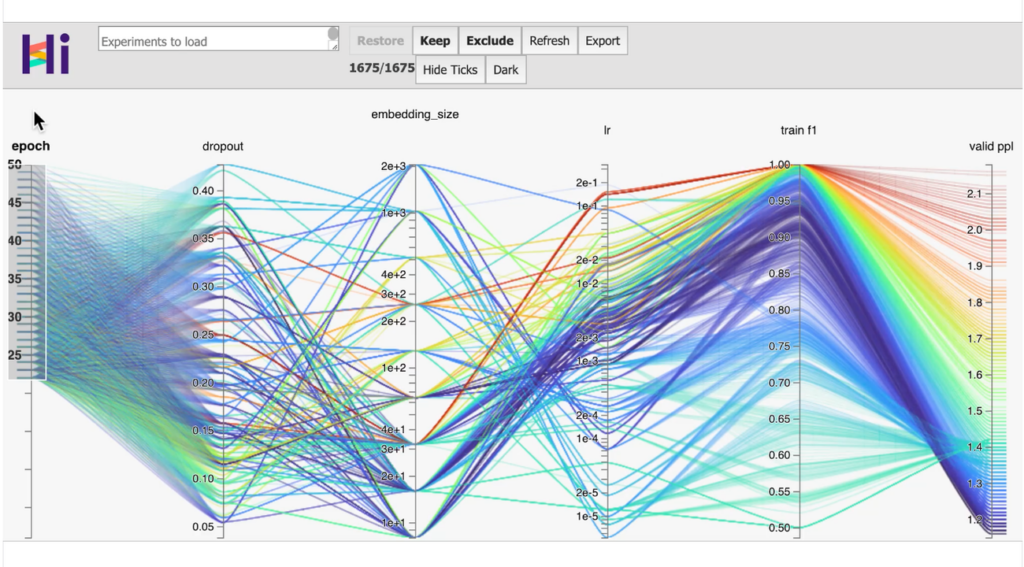
Image Source: Synced
Originally developed by Facebook AI Research, HiPlot emerges as a powerful open-source tool for analyzing high-dimensional data through interactive visualizations [37].
HiPlot AI Capabilities
The platform primarily excels in parallel plot visualization, enabling researchers to discover correlations and patterns in complex datasets [37]. Fundamentally, the interactive nature of parallel plots allows users to customize visualizations by focusing on specific value ranges, reordering axes, or extracting particular data selections [37]. The system distinctly supports population-based training visualization, making it easier to spot patterns in genetic algorithms [37].
HiPlot Cost Benefits
As an open-source solution, HiPlot offers complete accessibility without licensing fees. The platform mainly operates through two deployment options:
- IPython notebook integration for Python data analysis
- Web server deployment for CSV and JSON file visualization [37]
HiPlot Technical Requirements
The platform runs on standard computing infrastructure, with the following specifications:
| Component | Requirement |
|---|---|
| Installation | pip install -U hiplot or conda install |
| Server Access | http://127.0.0.1:5005/ |
| File Support | CSV, JSON, Custom Python parser |
| Integration | Compatible with wav2letter, Nevergrad, fairseq |
Ultimately, HiPlot’s lightweight architecture enables quick implementation in Jupyter notebooks without complex setup procedures [37]. The system has proven its scalability at Facebook AI, successfully analyzing deep neural networks with dozens of hyperparameters across more than 100,000 experiments [37].
Google Charts
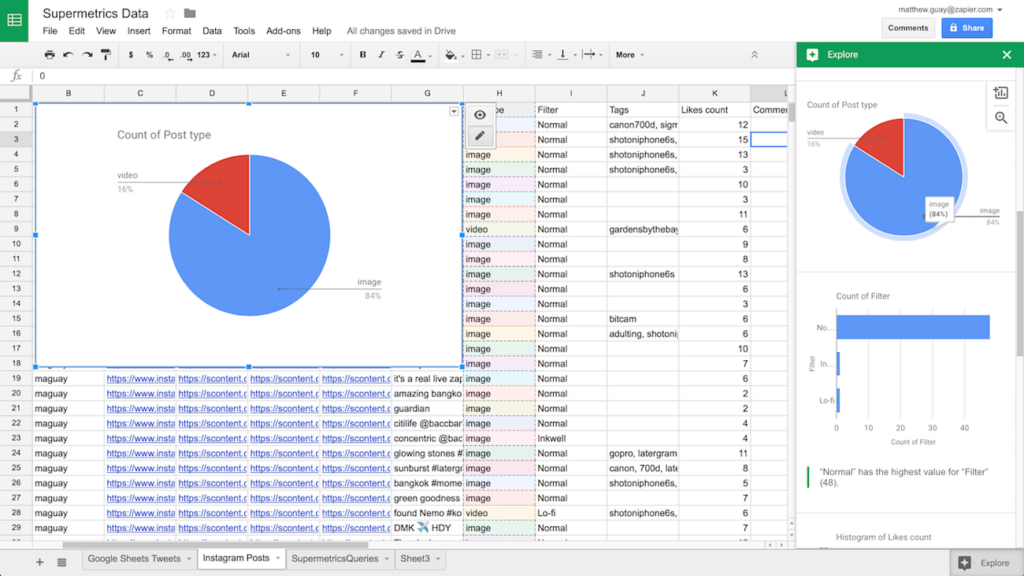
Image Source: Zapier
Google Charts brings machine learning capabilities to web-based data visualization, enabling instant chart creation through natural language commands [38].
Google Charts AI Features
The platform’s Explore feature processes natural language queries to analyze data patterns [38]. For instance, users can ask “what is the distribution of products sold?” or “what are average sales on Sundays?” to generate instant visualizations [38]. The system’s machine learning algorithms automatically suggest optimal chart types based on data structure and user requirements [9].
Google Charts Pricing
The platform operates entirely free of charge, offering:
| Feature | Availability |
|---|---|
| Interactive Charts | Unlimited |
| Data Tools | Complete Access |
| Backward Compatibility | 3-year guarantee [7] |
| Cross-platform Support | Full Coverage |
Google Charts Integration Guide
The platform fundamentally excels in cross-browser compatibility through HTML5/SVG technology [9]. The DataTable class manages data population, enabling seamless switching between chart types [9]. Through JavaScript implementation, charts integrate directly into web pages, supporting events and dashboard creation [9].
The system primarily operates through simple JavaScript that loads required libraries and creates chart objects within div elements [9]. Through this approach, developers can customize an extensive set of options to match their website’s design perfectly [7]. The platform’s cross-platform portability extends to iOS and new Android releases without requiring additional plugins [7].
Conclusion
Choosing the right AI data visualization tool depends heavily on specific organizational needs and resources. Enterprise solutions like Tableau and Power BI offer comprehensive features with robust security, while platforms like Polymer and Akkio provide more specialized capabilities for specific use cases.
Free options such as Google Charts and HiPlot make AI-powered visualization accessible to teams with limited budgets. Above all, these tools share a common thread – natural language processing capabilities that simplify complex data analysis tasks.
The rapid advancement of AI technology continues to reshape data visualization. Therefore, organizations should evaluate their requirements carefully, considering factors like:
- Integration capabilities with existing systems
- Pricing structure alignment with budget
- Security protocols and compliance standards
- Ease of use and learning curve
- Scalability potential
Ultimately, success with these tools comes from matching organizational needs with the right feature set rather than simply choosing the most advanced or expensive option. The best AI visualization tool is one that helps teams make faster, better-informed decisions while staying within resource constraints.
References
[1] – https://www.sisense.com/blog/add-gen-ai-powered-analytics-to-apps/
[2] – https://www.sisense.com/ai-analytics-platform/data-modeling-tool/
[3] – https://cloud.google.com/blog/products/business-intelligence/looker-roadmap-for-the-generative-ai-era
[4] – https://www.polymersearch.com/data-analysis-guide/automated-data-analysis-everything-you-need-to-know
[5] – https://www.luzmo.com/blog/domo-pricing
[6] – https://www.akkio.com/pricing
[7] – https://developers.google.com/chart
[8] – https://www.techtarget.com/searchbusinessanalytics/news/366615693/ThoughtSpot-AI-agent-Spotter-enables-conversational-BI
[9] – https://developers.google.com/chart/interactive/docs
[10] – https://docs.thoughtspot.com/cloud/latest/consumption-pricing.html
[11] – https://www.thoughtspot.com/spotiq/ai-data-intelligence
[12] – https://www.luzmo.com/blog/thoughtspot-pricing
[13] – https://www.qlik.com/us/augmented-analytics/ai-analytics
[14] – https://www.qlik.com/us/products/qlik-ai-ml
[15] – https://www.qlik.com/us/pricing/ai-ml-products-pricing
[16] – https://www.qlik.com/us/pricing
[17] – https://www.qlik.com/us/news/company/press-room/press-releases/qlik-introduces-more-rapid-enterprise-ai-adoption-through-new-integration-with-databricks-ai-functions
[18] – https://www.sisense.com/blog/data-to-decisions-exploring-power-of-ai-dashboard/
[19] – https://www.sisense.com/whitepapers/sisense-ai-throughout/
[20] – https://appvero.com/articles/understanding-cost-sisense/
[21] – https://www.sisense.com/ai-analytics-platform/
[22] – https://www.techtarget.com/searchbusinessanalytics/news/366615533/Googles-Looker-taking-an-agentic-approach-to-generative-AI
[23] – https://cloud.google.com/looker/pricing
[24] – https://cloud.google.com/looker-bi
[25] – https://10web.io/ai-tools/polymer/
[26] – https://www.polymersearch.com/ai-dashboard-generator
[27] – https://www.polymersearch.com/pricing
[28] – https://www.polymersearch.com/
[29] – https://www.domo.com/blog/ai-readiness-complete-guide-and-checklist/
[30] – https://www.businesswire.com/news/home/20230829791320/en/Domo-Announces-Domo.AI-to-Revolutionize-the-Way-Businesses-Manage-and-Deploy-Artificial-Intelligence
[31] – https://www.domo.com/pricing
[32] – https://www.datapad.io/blog/domo-pricing
[33] – https://www.domo.com/business-intelligence/visualizations-and-dashboards
[34] – https://www.akkio.com/post/ai-data-analytics
[35] – https://www.akkio.com/integrations
[36] – https://www.akkio.com/landing-page/data-visualization
[37] – https://ai.meta.com/blog/hiplot-high-dimensional-interactive-plots-made-easy/
[38] – https://blog.google/products/g-suite/visualize-data-instantly-machine-learning-google-sheets/

