When did you last notice a static map in a presentation? Probably never. That animated route tracking an experience across continents likely captured your attention.
Most people think creating an animated map requires professional design skills. Modern tools and technologies have made the process surprisingly straightforward.
You can create animated travel maps to showcase vacation memories, design map animations for video content, or build interactive visualizations with Google Maps Studio. Our team can create custom animated map videos that match your requirements if you need expert help or lack time.
This piece covers everything about crafting engaging animated maps, from simple principles to advanced techniques. Let’s begin!
Understanding Animated Map Fundamentals
The fascinating world of animated maps has grown by a lot since Norman Thrower first introduced the concept in 1959 [1]. These dynamic visualizations have become powerful tools that tell stories and present data in compelling ways.
Types of Map Animations
We work with two main categories of map animations:
- Temporal Animations: These show changes over time, perfect for displaying historical events, weather patterns, or demographic changes [2]
- Non-temporal Animations: These focus on variables other than time, such as location changes, zoom levels, or data transformations [2]
Key Elements of an Engaging Animated Map
An animated map’s success depends on several dynamic variables we need to think about:
- Duration and Pacing: Change speed affects how well users understand the content [3]
- Rate of Change: Information differences between frames [3]
- Visual Hierarchy: Element organization that guides viewer’s attention
- Synchronization: Multiple animated elements’ timing [3]
Common Use Cases and Applications
Animated maps reshape the scene across many industries. They work best in:
- Healthcare: Visualizing insurance costs and medicare readmission rates [1]
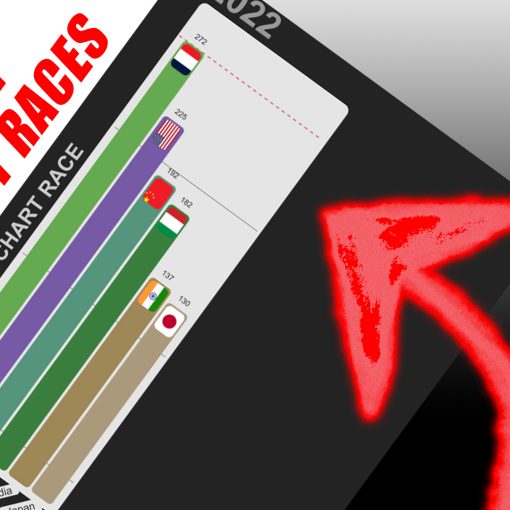
- Statistics: Showing statistics visually over Geographic Maps. like in this video where we show the IQ Test results in Europe.
- Tourism: Creating engaging travel itineraries and destination showcases [1]
- Journalism: Telling complex geographic stories with visual clarity [1]
- Weather Reporting: Displaying temperature changes and rainfall patterns [1]
Our team creates custom animated maps that bring your data to life. We help you build engaging animated visualizations for business presentations, educational content, or interactive web experiences.
Planning Your Animated Map
A solid foundation paves the way to create amazing animated maps. Our experience shows that proper planning makes the difference between good and great animations.
Choosing the Right Map Style
The right animation style sets the tone for your map. Your project needs will guide you to pick from these core animation types:
- Jump: Direct transitions with no animation effects
- Ease: Smooth, minimal transitions between points
- Fly: Dramatic flight-like animations between locations [4]
Storyboarding Your Animation
Storyboarding plays a vital role in creating engaging animated maps. A visual blueprint helps us understand map movements, layer visibility, and important annotations [5]. This planning phase lets us organize our layer list and prevents the work from getting pricey later in the animation process.
Gathering Required Assets
Professional animated maps need several key elements working together. Our process has map screenshots, marked paths, and travel icons [6]. We organize all assets in the right format before we start the animation work.
Want a custom animated map but short on time? We create tailored animated map videos that match your needs. Share your requirements, and we’ll take care of everything from planning to delivery.
Note that thorough preparation leads to successful animated maps. A careful look at these elements before animation helps create engaging and effective map animations that hit their mark perfectly.
Essential Design Principles
Strong design principles are the foundations of engaging visualizations in animated maps. Let’s explore everything that makes your animated maps captivating.
Color and Contrast Guidelines
Accessibility remains our priority in map designs. The maps need contrast ratios of at least 4.5:1 for normal text and 3:1 for large text [7]. These color strategies have proven effective:
- Bold colors highlight vital information
- Gentle color transitions prevent sensory overload
- Textures enhance contrast between challenging map layers
- Interface elements need a 3:1 contrast ratio [7]
Animation Timing and Pacing
Timing plays a significant role in user comprehension. Data visualization can span various timeframes – an afternoon’s data in 10 seconds or a century’s worth in 30 seconds [8]. Your specific data and audience determine the ideal pacing.
Visual Hierarchy Best Practices
A clear visual hierarchy guides viewers through your map’s story naturally. Important elements should pop while subtle background elements support the narrative [9]. Size and color values create impact – larger objects catch attention quickly, and darker objects stand out against light backgrounds [9].
Our team can help you create custom animated map videos that follow these best practices. Share your requirements with us, and we’ll manage the technical aspects while crafting your map’s compelling story.
Note that visual hierarchy goes beyond esthetics. Your map’s visual importance should match its intellectual hierarchy [9]. This approach helps your animated map deliver its message effectively while meeting professional standards and accessibility requirements.
Advanced Animation Techniques
Let us show you our advanced techniques to create captivating animated maps. These methods will help you produce professional-quality animations that grab your audience’s attention once you know the basics.
Creating Smooth Path Animations
Smooth path animations are vital to tell compelling map stories. Linear interpolation ensures fluid camera movements between keyframes [10]. The animationPhase value calculation and setPaintProperty() create smooth transitions that reveal map elements step by step [10].
Adding Interactive Elements
Static maps become dynamic storytelling tools with interactive features. User engagement rises substantially when you add:
- Clickable icons with pop-up information windows
- Dynamic overlays that update based on camera position
- Immediate data updates with synchronized animations [11]
Incorporating Visual Effects
Visual effects bring creative, abstract elements to your map animations. Effects applied to the entire scene combine with camera movements to produce stunning results [12]. We make sure these effects work well with video export to maintain quality throughout rendering [12].
You don’t need to dive into technical details to create professional map animations. Tell us what you envision, and we’ll take care of everything from smooth animations to interactive elements and visual effects.
Conclusion
Animated maps have evolved beyond complex design projects into available visualization tools that anyone can create. Strong design principles, proper planning, and advanced animation techniques help us build engaging map animations. These elements tell compelling stories and present data with clarity.
The path to creating professional animated maps starts with mastering the basics. You need to apply the right animation techniques based on your specific needs. This applies whether you create temporal animations showing changes over time or non-temporal animations highlighting specific data points.
Each element shapes the final product. Color choices and animation timing work together to create impactful map animations. Our team can help turn your data and stories into dynamic, engaging map animations that captivate your audience. Let us know if you want us to create an animated map video for you!
References
[1] – https://www.animaker.com/blog/11-ways-use-animated-maps/
[2] – https://en.wikipedia.org/wiki/Animated_mapping
[3] – https://www.e-education.psu.edu/geog486/node/720
[4] – https://mapme.com/support/knowledgebase/map-animation-style/
[5] – https://www.esri.com/arcgis-blog/products/arcgis-storymaps/mapping/animating-migration/
[6] – https://filmora.wondershare.com/animated-video/how-to-make-animated-travel-map-video.html
[7] – https://mn.gov/mnit/assets/Accessibility%20Guide%20for%20Interactive%20Web%20Maps_tcm38-403564.pdf
[8] – https://pro.arcgis.com/en/pro-app/latest/help/mapping/animation/animate-through-time.htm
[9] – https://www.axismaps.com/guide/visual-hierarchy
[11] – https://pro.arcgis.com/en/pro-app/latest/help/mapping/animation/animate-the-camera.htm
[12] – https://pro.arcgis.com/en/pro-app/latest/help/mapping/properties/apply-visual-effects-in-maps-and-scenes.htm


